Image:CO2-Temp.png
Un article de Wikipédia, l'encyclopédie libre.
Taille de cet aperçu : 800 × 429 pixels
Image en plus haute résolution (1 200 × 644 pixels, taille du fichier : 22 Kio, type MIME : image/png)
| | Ce fichier provient de Wikimedia Commons?. Les informations le concernant sont affichées ci-dessous (procédure). |
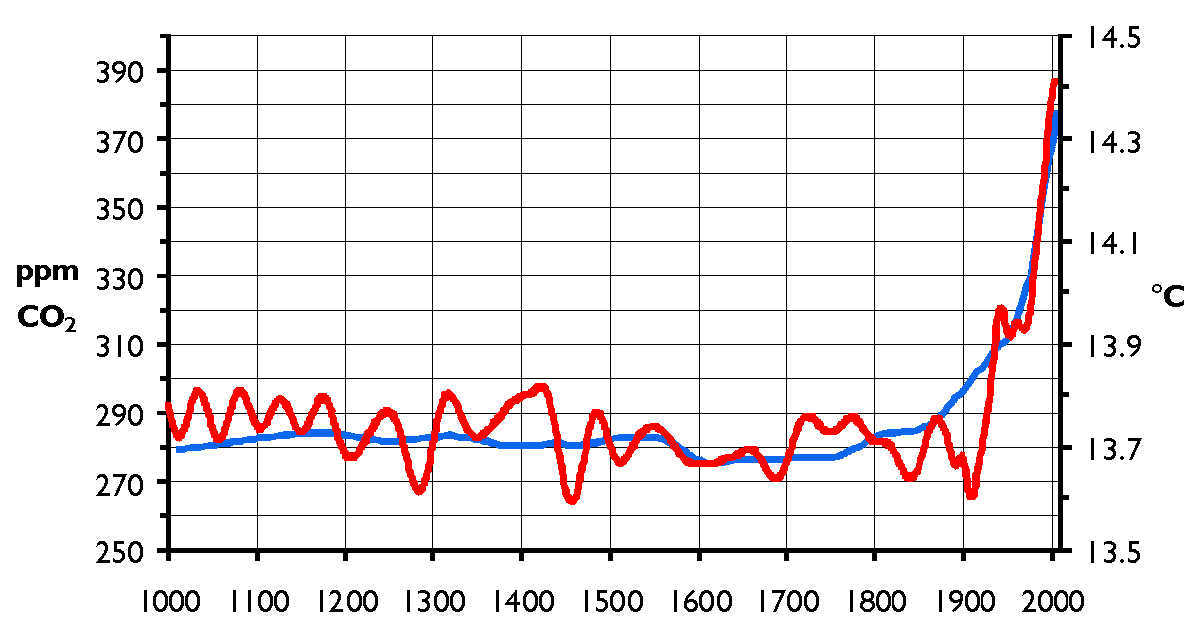
- Description: Atmospheric carbon dioxide concentration and mean global temperature during the past 1000 years. Carbon dioxide levels (blue line, left-hand axis) are given in parts per million (volume), temperatures (red line, right-hand axis) in degrees centigrade.
- Source: graph drawn by Hanno using data from different sources. For the temperature data, see Global temperature 1ka.png. CO2 levels are based on historical carbon dioxide records from ice cores drilled at the Law Dome in Antarctica, published on the web by D.M. Etheridge, L.P. Steele, R.L. Langenfelds & R.J. Francey (1998) as "Historical CO2 records from the Law Dome DE08, DE08-2, and DSS ice cores". In Trends: A Compendium of Data on Global Change. Carbon Dioxide Information Analysis Center, Oak Ridge National Laboratory, U.S. Department of Energy, Oak Ridge, Tenn., U.S.A. [http://cdiac.esd.ornl.gov/trends/co2/lawdome.html]
- Licence: released under the GNU Free Documentation Licence and the cc-by-sa-2.5 Licence by the photographer
|

 |
This graph image should be recreated using vector graphics as an SVG file. This has several advantages; see Commons:Media for cleanup for more information. If an SVG form of this image is already available, please upload it. After uploading an SVG, replace this template with template {{Vector version available|new image name.svg}} in this image. |
|
العربية | Български | Català | Česky | Dansk | Deutsch | English | Esperanto | Español | Français | 한국어 | Italiano | Magyar | Lietuvių | Nederlands | 日本語 | Polski | Português | Română | Русский | Suomi | Svenska | Türkçe | Українська | Tiếng Việt | मराठी | 中文(繁體) | 中文(简体) | +/- |
|
Historique du fichier
Cliquer sur une date et une heure pour voir le fichier tel qu’il était à ce moment-là
| Date et heure | Dimensions | Utilisateur | Commentaire | |
|---|---|---|---|---|
| actuel | 6 décembre 2005 à 15:30 | 1 200×644 (22 Kio) | Hanno |
Pages contenant l’image
La page ci-dessous contient cette image :

