Image:AYool GLODAP del pH.png
Un article de Wikipédia, l'encyclopédie libre.
Taille de cet aperçu : 800 × 539 pixels
Image en plus haute résolution (1 683 × 1 133 pixels, taille du fichier : 232 Kio, type MIME : image/png)
| | Ce fichier provient de Wikimedia Commons?. Les informations le concernant sont affichées ci-dessous (procédure). |
[edit] Summary
| Description |
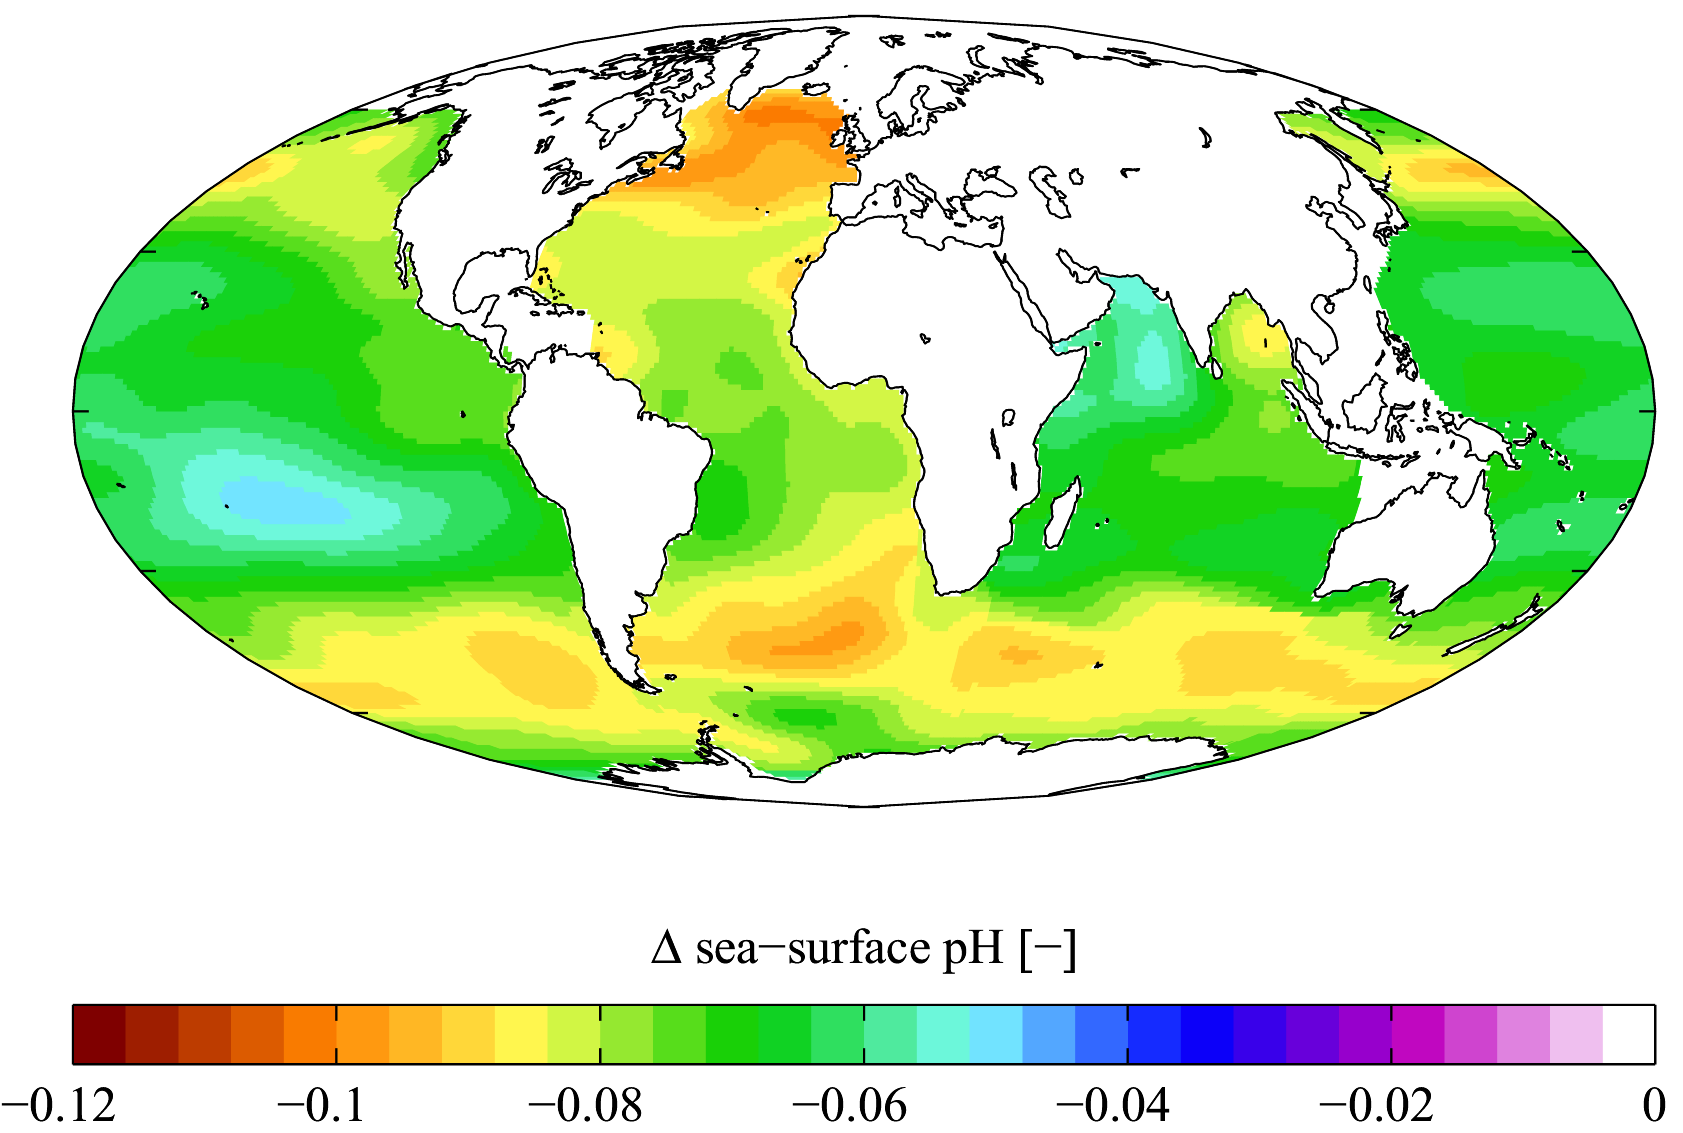
English: Estimated change in sea surface pH from the pre-industrial period (1700s) to the present day (1990s). Δ pH here is in standard pH units. This change is caused by the invasion of anthropogenic CO2 (see Ocean acidification). Calculated using Richard Zeebe's csys package with data from the Global Ocean Data Analysis Project[1][2] and World Ocean Atlas[3] climatologies. Δ pH is plotted here using a Mollweide projection (using MATLAB and the M_Map package).
|
|---|---|
| Source |
English Wikipedia |
| Date |
13 February 2007 |
| Author | |
| Permission (Reusing this image) |
see below |
[edit] References
- ↑ Gruber, N., Sarmiento, J.L. and Stocker, T.F. (1996). An improved method for detecting anthropogenic CO2 in the oceans, Global Biogeochemical Cycles 10:809–837
- ↑ Using estimated pre-industrial (1700s) and measured present day (1990s) fields of DIC
- ↑ In the absence of estimated pre-industrial (1700s) fields of temperature and salinity, present day (1990s) fields were used (although these contain a small signal from global warming)
[edit] Licensing
|

Historique du fichier
Cliquer sur une date et une heure pour voir le fichier tel qu’il était à ce moment-là
| Date et heure | Dimensions | Utilisateur | Commentaire | |
|---|---|---|---|---|
| actuel | 2 avril 2007 à 18:16 | 1 683×1 133 (232 Kio) | Nils Simon | (== Summary == Change in sea surface pH from the pre-industrial period (1700s) to the present day (1990s). Calculated using [http://www.soest.hawaii.edu/oceanography/faculty/zeebe.html Richard Zeebe]'s [http://www.soe) |
Pages contenant l’image
La page ci-dessous contient cette image :

