Image:Ukrainian parliamentary election, 2007 (Results).PNG

Un article de Wikipédia, l'encyclopédie libre.

Ci-dessous, retrouvez page de description du fichier provenant de Commons.

[edit] Summary

Description

English: Ukrainian parliamentary election, 2007.

Source

Self-made based off map by Muumi with data from Central Election Commission of Ukraine

Date

February 11 , 2008

Author

User:DemocracyATwork

Permission
(Reusing this image)
Creative Commons License
Creative Commons Attribution iconCreative Commons Share Alike icon
This file is licensed under Creative Commons Attribution ShareAlike 1.0 License


[edit] Collection

Results of the parliamentary elections:
Politcal alignment 2007
Vote percenatge 2006 to 2007 (Top Six parties)
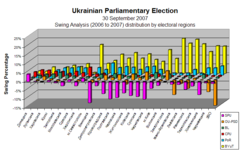
Swing 2006 to 2007 (Top Six parties)

Maps and charts including regional analysis of the parliamentary elections 2007

Highest Vote per region
Statistical charts:
Percentage per region of total national vote Vote Percentage 2007 by Region Swing by Electoral Regions


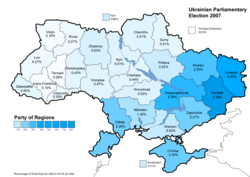
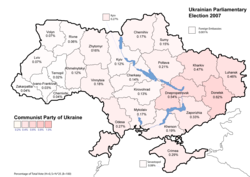
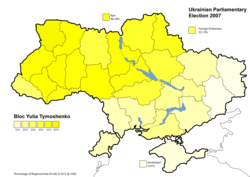
Maps showing the top six parties support - percentage per region of total national vote
Party of Regions  results (34.37%)
Bloc Yulia Tymoshenko results (30.71%
Our Ukraine People's Self-Defence results (14.15%)
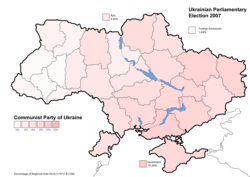
Communist Party of Ukraine results (5.39%)
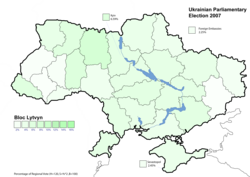
Bloc Lytvyn Party results (3.96%)
Socialist Party of Ukraine results (2.86%)
Maps showing the top six parties support - percentage of vote per region
Party of Regions  results (34.37%)
Bloc Yulia Tymoshenko results (30.71%
Our Ukraine People's Self-Defence results (14.15%)
Communist Party of Ukraine results (5.39%)
Bloc Lytvyn Party results (3.96%)
Socialist Party of Ukraine results (2.86%)


2007 [1] [2] [3] [4] [5] [6]

2006 [7] [8] [9] [10] [11] [12]

A swing analysis is common in any election. It shows the change in voter percentage for each party by regions from 2006 to 2007.

[edit] Licensing

Public domain I, the copyright holder of this work, hereby release it into the public domain. This applies worldwide.

In case this is not legally possible:
I grant anyone the right to use this work for any purpose, without any conditions, unless such conditions are required by law.


Afrikaans | Alemannisch | Aragonés | العربية | Asturianu | Български | Català | Česky | Cymraeg | Dansk | Deutsch | Eʋegbe | Ελληνικά | English | Español | Esperanto | Euskara | Estremeñu | فارسی | Français | Galego | 한국어 | हिन्दी | Hrvatski | Ido | Bahasa Indonesia | Íslenska | Italiano | עברית | Kurdî / كوردی | Latina | Lietuvių | Latviešu | Magyar | Македонски | Bahasa Melayu | Nederlands | ‪Norsk (bokmål)‬ | ‪Norsk (nynorsk)‬ | 日本語 | Polski | Português | Ripoarisch | Română | Русский | Shqip | Slovenčina | Slovenščina | Српски / Srpski | Svenska | ไทย | Tagalog | Türkçe | Українська | Tiếng Việt | Walon | ‪中文(简体)‬ | ‪中文(繁體)‬ | zh-yue-hant | +/-

Historique du fichier

Cliquer sur une date et une heure pour voir le fichier tel qu’il était à ce moment-là

Date et heureDimensionsUtilisateurCommentaire
actuel20 février 2008 à 19:03772×477 (19 Kio)DemocracyATwork (Ukrainian Parliementary Election 2007 Results of election (Political Aligment) chart. Removed boarder.)
18 février 2008 à 01:05756×462 (19 Kio)DemocracyATwork (Update to reflect color change for Bloc Lytvyn to match with the Parliamentary seat allocation map. From grey to green. )
13 février 2008 à 00:41756×462 (23 Kio)DemocracyATwork (== Summary == {{Information |Description='''English:''' Ukrainian parliamentary election, 2007. |Source=Self-made based off map by Muumi with data fr)
8 février 2008 à 10:55756×462 (24 Kio)DemocracyATwork

Les pages ci-dessous contiennent cette image :