Image:Ukrainian parliamentary election, 2007 (Percentage).PNG

Un article de Wikipédia, l'encyclopédie libre.

Ci-dessous, retrouvez page de description du fichier provenant de Commons.

[edit] Summary

Description

English: Ukrainian parliamentary election, 2007.

Source

Self-made based off map by Muumi with data from Central Election Commission of Ukraine

Date

February 11 , 2008

Author

User:DemocracyATwork

Permission
(Reusing this image)
Creative Commons License
Creative Commons Attribution iconCreative Commons Share Alike icon
This file is licensed under Creative Commons Attribution ShareAlike 1.0 License


[edit] Collection

Results of the parliamentary elections:
Politcal alignment 2007
Vote percenatge 2006 to 2007 (Top Six parties)
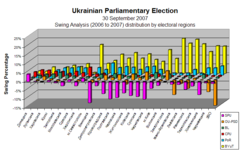
Swing 2006 to 2007 (Top Six parties)

Regional Analysis of the parliamentary elections:

Highest Vote per region
Charts showing the top six parties support - percentage of total national vote and Electoral Region
Vote Percentage by Electoral Region Vote Percentage by Electoral Region Swing by Electoral Regions
Maps showing the top six parties support - percentage of total national vote
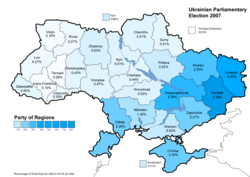
Party of Regions  results (34.37%)
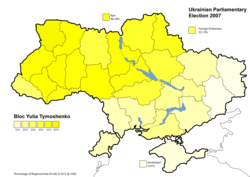
Bloc Yulia Tymoshenko results (30.71%
Our Ukraine People's Self-Defence results (14.15%)
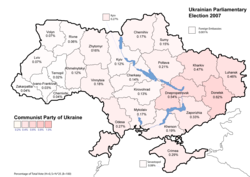
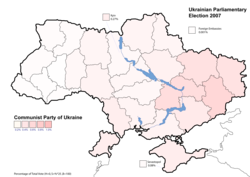
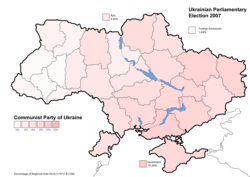
Communist Party of Ukraine results (5.39%)
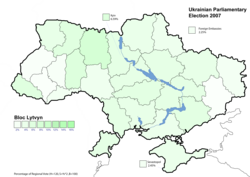
Bloc Lytvyn Party results (3.96%)
Socialist Party of Ukraine results (2.86%)
Maps showing the top six parties support - percentage of total national vote (Minimal text)
Party of Regions  results (34.37%)
Bloc Yulia Tymoshenko results (30.71%
Our Ukraine People's Self-Defence results (14.15%)
Communist Party of Ukraine results (5.39%)
Bloc Lytvyn Party results (3.96%)
Socialist Party of Ukraine results (2.86%)
Maps showing the top six parties support - percentage per region
Party of Regions  results (34.37%)
Bloc Yulia Tymoshenko results (30.71%
Our Ukraine People's Self-Defence results (14.15%)
Communist Party of Ukraine results (5.39%)
Bloc Lytvyn Party results (3.96%)
Socialist Party of Ukraine results (2.86%)


2007 [1] [2] [3] [4] [5] [6]

2006 [7] [8] [9] [10] [11] [12]

A swing analysis is common in any election. It shows the change in voter percentage for each party by regions from 2006 to 2007.

[edit] Licensing

Public domain I, the copyright holder of this work, hereby release it into the public domain. This applies worldwide.

In case this is not legally possible:
I grant anyone the right to use this work for any purpose, without any conditions, unless such conditions are required by law.


Afrikaans | Alemannisch | Aragonés | العربية | Asturianu | Български | Català | Česky | Cymraeg | Dansk | Deutsch | Eʋegbe | Ελληνικά | English | Español | Esperanto | Euskara | Estremeñu | فارسی | Français | Galego | 한국어 | हिन्दी | Hrvatski | Ido | Bahasa Indonesia | Íslenska | Italiano | עברית | Kurdî / كوردی | Latina | Lietuvių | Latviešu | Magyar | Македонски | Bahasa Melayu | Nederlands | ‪Norsk (bokmål)‬ | ‪Norsk (nynorsk)‬ | 日本語 | Polski | Português | Ripoarisch | Română | Русский | Shqip | Slovenčina | Slovenščina | Српски / Srpski | Svenska | ไทย | Tagalog | Türkçe | Українська | Tiếng Việt | Walon | ‪中文(简体)‬ | ‪中文(繁體)‬ | zh-yue-hant | +/-

Historique du fichier

Cliquer sur une date et une heure pour voir le fichier tel qu’il était à ce moment-là

Date et heureDimensionsUtilisateurCommentaire
actuel20 février 2008 à 19:04768×477 (10 Kio)DemocracyATwork (Ukrainian Parliementary Election 2007 Results of election (Top six parties percentage) chart. Removed boarder.)
18 février 2008 à 01:06460×273 (7 Kio)DemocracyATwork (Update to reflect color change for Bloc Lytvyn to match with the Parliamentary seat allocation map. From grey to geen. )
12 février 2008 à 20:23460×273 (8 Kio)DemocracyATwork ({| class="wikitable" |- |+ Results of the parliamentary elections: |- | Politcal alignment 2007 | [[Image:Ukrainian parliamentary election, 2007 (Percentage).PNG|250px|center|Vote)

Les pages ci-dessous contiennent cette image :