Image:Gamma distribution pdf.png
Un article de Wikipédia, l'encyclopédie libre.
Taille de cet aperçu : 800 × 600 pixels
Image en plus haute résolution (1 300 × 975 pixels, taille du fichier : 159 Kio, type MIME : image/png)
| | Ce fichier provient de Wikimedia Commons?. Les informations le concernant sont affichées ci-dessous (procédure). |
Related links:
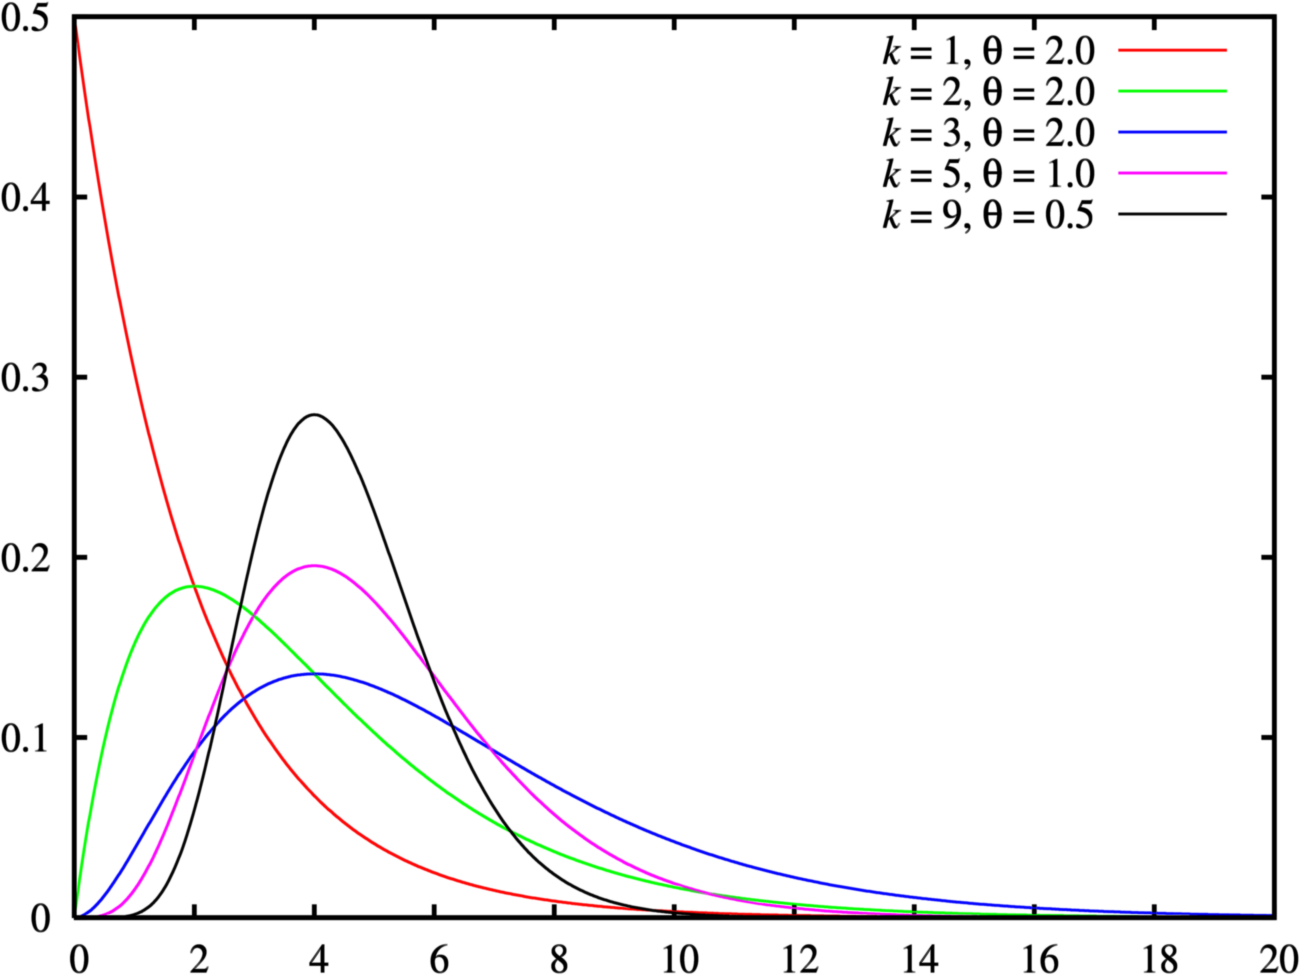
Probability density function for the Gamma distribution
gnuplot source under GPL:
_ln_dgamma(x, a, b) = a*log(b) - lgamma(a) + (a-1)*log(x) - b*x
dgamma(x, shape, rate) =\
 (x<0)? 0 :\
 (x==0)? ((shape<1)? 1/0 : (shape==1)? rate : 0) :\
 (rate==0)? 0 :\
 exp(_ln_dgamma(x, shape, rate))
pgamma(x, shape, rate) = (x<0)? 0 : igamma(shape, x*rate)

set samples 1001
set terminal postscript enhanced color solid lw 2 "Times-Roman" 20
set output

set xtics 0,2
set ytics 0,0.1

f(x, k, t) = dgamma(x, k, 1.0/t)
set key top right

#f(x, k, t) = pgamma(x, k, 1.0/t)
#set key bottom right

plot [0:20] \
    f(x,1,2.0) title "{/Times-Italic k} = 1, {/Symbol q} = 2.0", \
    f(x,2,2.0) title "{/Times-Italic k} = 2, {/Symbol q} = 2.0", \
    f(x,3,2.0) title "{/Times-Italic k} = 3, {/Symbol q} = 2.0", \
    f(x,5,1.0) title "{/Times-Italic k} = 5, {/Symbol q} = 1.0", \
    f(x,9,0.5) title "{/Times-Italic k} = 9, {/Symbol q} = 0.5" lt 7
| This vector image was created with gnuplot. |
 |
This work is free software; you can redistribute it and/or modify it under the terms of the GNU General Public License as published by the Free Software Foundation; either version 2 of the License, or any later version. This work is distributed in the hope that it will be useful, but WITHOUT ANY WARRANTY; without even the implied warranty of MERCHANTABILITY or FITNESS FOR A PARTICULAR PURPOSE. See version 2 and version 3 of the GNU General Public License for more details.
العربية | Català | Česky | Deutsch | Ελληνικά | English | Español | فارسی | Français | Italiano | 日本語 | Nederlands | Polski | Português | Русский | Slovenčina | Svenska | Türkçe | 中文(简体) | 中文(繁體) | +/- |
 |
This graph image should be recreated using vector graphics as an SVG file. This has several advantages; see Commons:Media for cleanup for more information. If an SVG form of this image is already available, please upload it. After uploading an SVG, replace this template with template {{Vector version available|new image name.svg}} in this image. |
|
العربية | Български | Català | Česky | Dansk | Deutsch | English | Esperanto | Español | Français | 한국어 | Italiano | Magyar | Lietuvių | Nederlands | 日本語 | Polski | Português | Română | Русский | Suomi | Svenska | Türkçe | Українська | Tiếng Việt | मराठी | 中文(繁體) | 中文(简体) | +/- |
|
Historique du fichier
Cliquer sur une date et une heure pour voir le fichier tel qu’il était à ce moment-là
| Date et heure | Dimensions | Utilisateur | Commentaire | |
|---|---|---|---|---|
| actuel | 10 mars 2005 à 22:34 | 1 300×975 (159 Kio) | MarkSweep | (new version of PDF and matching CDF) |
| 10 mars 2005 à 19:45 | 960×720 (135 Kio) | Cburnett | (Probability density function for the Gamma distribution {{GFDL}}) |
Pages contenant l’image
La page ci-dessous contient cette image :

