Image:Bmi30chart.png
Un article de Wikipédia, l'encyclopédie libre.
Taille de cet aperçu : 800 × 491 pixels
Image en plus haute résolution (1 467 × 901 pixels, taille du fichier : 120 Kio, type MIME : image/png)
| | Ce fichier provient de Wikimedia Commons?. Les informations le concernant sont affichées ci-dessous (procédure). |
[edit] Summary
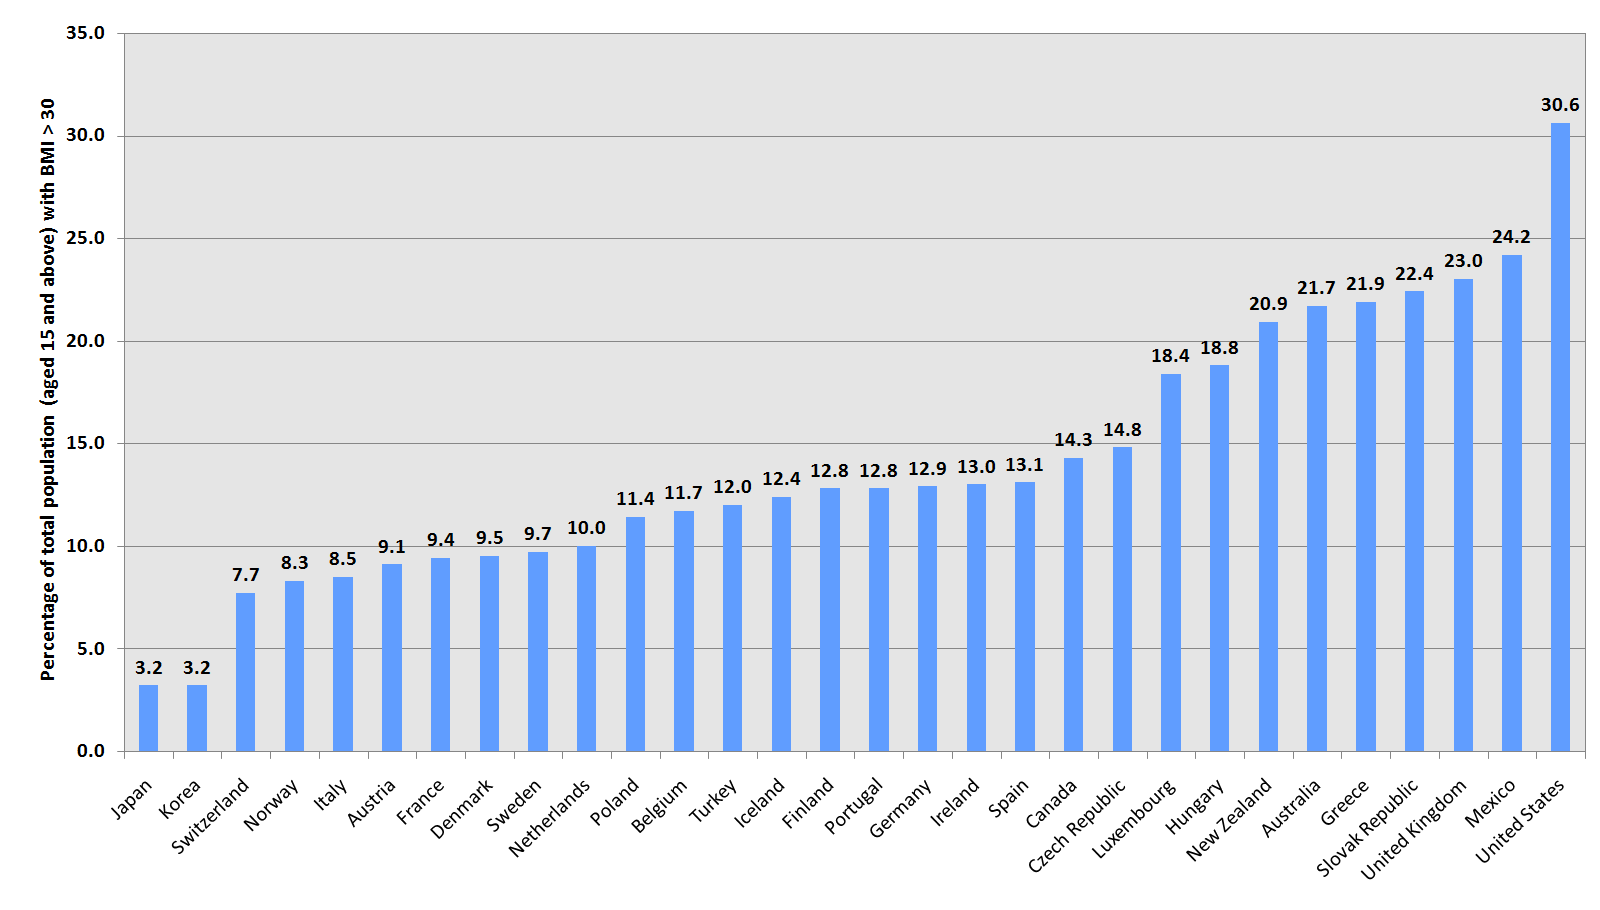
This chart compares obesity figures in the population of OECD countries; it shows the percentage of total population (aged 15 and above) with a body-mass index greater than 30. The year the figures used for this chart were published, collected or compiled range from 1996 to 2003. Exact years for each country can be found in the documents linked below. Graphic chart created by w:User:Phils using Microsoft Excel 2004 (Mac) and OECD data available for download and discussed here. The actual data was extracted from an Excel data sheet downloadable here, which contains the following source information:
- OECD FACTBOOK 2005 – ISBN 92-64-01869-7 – © OECD 2005
An alternate copyrighted graph of the same data, published by OECD can be viewed here. The font used in the picture is Adobe Foundry's Univers LT 55 (Regular).
[edit] Licensing
 |
Permission is granted to copy, distribute and/or modify this document under the terms of the GNU Free Documentation License, Version 1.2 or any later version published by the Free Software Foundation; with no Invariant Sections, no Front-Cover Texts, and no Back-Cover Texts. Subject to disclaimers. Asturianu | Български | Català | Deutsch | English | Español | Français | Gaeilge | Italiano | 한국어 | 日本語 | Polski | Português | Română | Türkçe | +/- |
Historique du fichier
Cliquer sur une date et une heure pour voir le fichier tel qu’il était à ce moment-là
| Date et heure | Dimensions | Utilisateur | Commentaire | |
|---|---|---|---|---|
| actuel | 4 mai 2006 à 19:11 | 1 467×901 (120 Kio) | Deprifry | (This chart compares obesity figures in the population of OECD countries; it shows the percentage of total population (aged 15 and above) with a body-mass index greater than 30. The year the figures used for this chart were published, collected or compiled) |
Pages contenant l’image
La page ci-dessous contient cette image :

