Image:T distributionCDF.png
Un article de Wikipédia, l'encyclopédie libre.
Taille de cet aperçu : 600 × 600 pixels
Image en plus haute résolution (1 200 × 1 200 pixels, taille du fichier : 18 Kio, type MIME : image/png)
| | Ce fichier provient de Wikimedia Commons?. Les informations le concernant sont affichées ci-dessous (procédure). |
[edit] Description
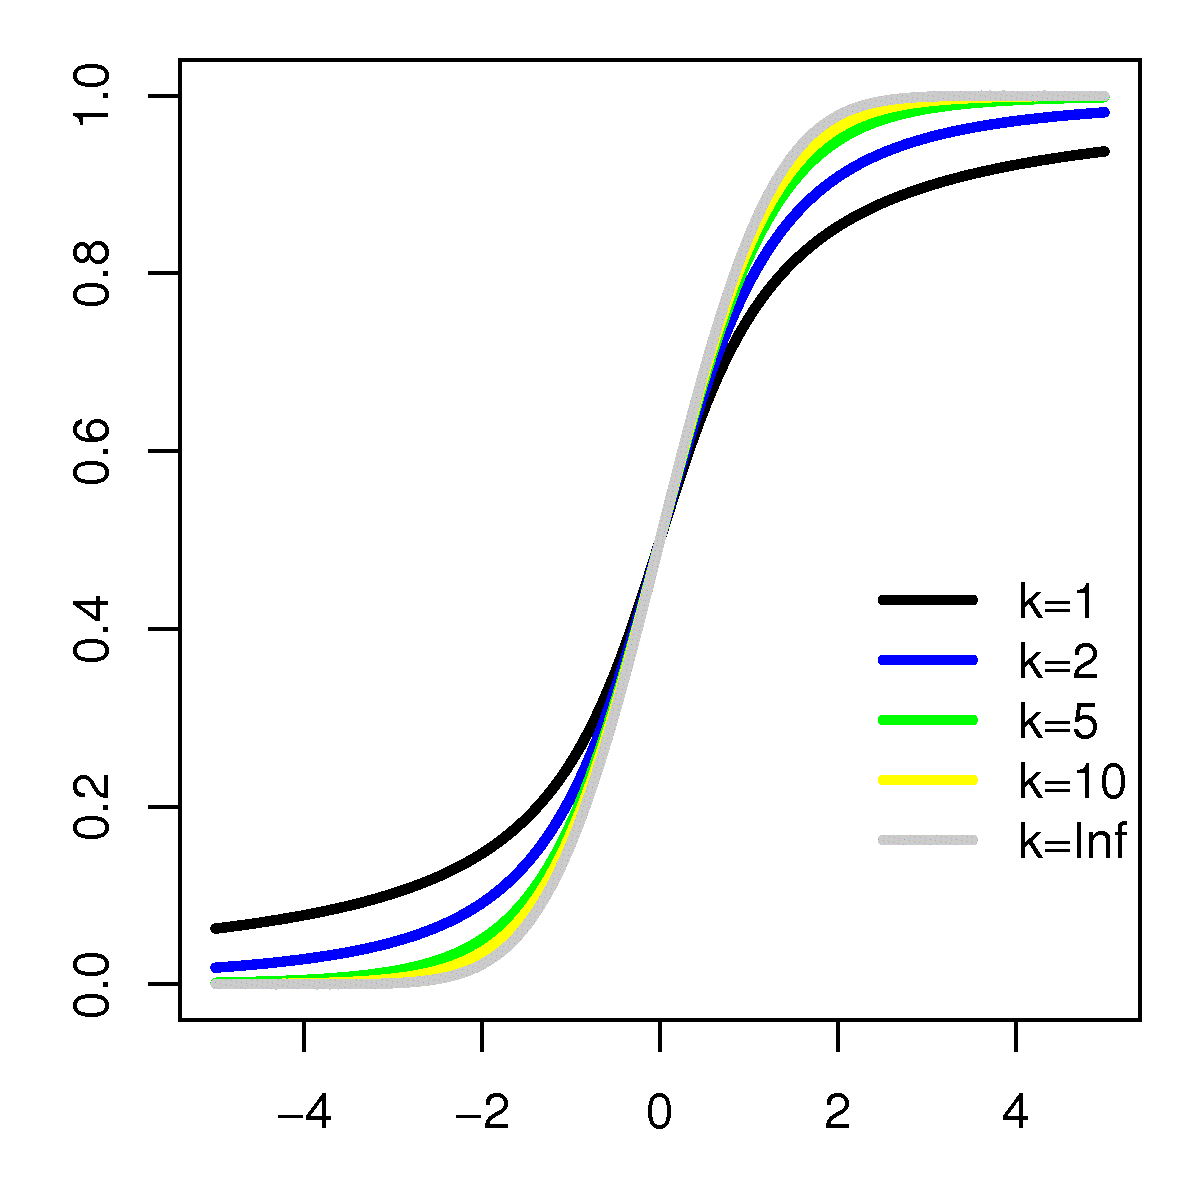
The CDF of the t-distribution
bitmap(file="t_distributionCDF.png",type="png256",width=4,height=4,res=300,pointsize=12)
par(mar=c(3,3,1,1))
x <- seq(-5,5,len=1000)
plot(range(x),c(0,1),type="n")
lines(x,pt(x,df=1),col="black",lwd=3)
lines(x,pt(x,df=2),col="blue",lwd=3)
lines(x,pt(x,df=5),col="green",lwd=3)
lines(x,pt(x,df=10),col="yellow",lwd=3)
lines(x,pt(x,df=Inf),col="grey",lwd=3)
legend(2,0.5,legend=c("k=1","k=2","k=5","k=10","k=Inf"),col=c("black","blue","green","yellow","grey"),lwd=3,bty="n")
dev.off()
[edit] Licensing
 |
Permission is granted to copy, distribute and/or modify this document under the terms of the GNU Free Documentation License, Version 1.2 or any later version published by the Free Software Foundation; with no Invariant Sections, no Front-Cover Texts, and no Back-Cover Texts. Subject to disclaimers. Asturianu | Български | Català | Deutsch | English | Español | Français | Gaeilge | Italiano | 한국어 | 日本語 | Polski | Português | Română | Türkçe | +/- |
Historique du fichier
Cliquer sur une date et une heure pour voir le fichier tel qu’il était à ce moment-là
| Date et heure | Dimensions | Utilisateur | Commentaire | |
|---|---|---|---|---|
| actuel | 16 mai 2006 à 19:58 | 1 200×1 200 (18 Kio) | Anarkman | (The CDF of the t-distribution <pre>bitmap(file="t_distributionCDF.png",type="png256",width=4,height=4,res=300,pointsize=12) par(mar=c(3,3,1,1)) x <- seq(-5,5,len=1000) plot(range(x),c(0,1),type="n") lines(x,pt(x,df=1),col="black",lwd=3) lines(x,pt(x,df=2) |
Pages contenant l’image
La page ci-dessous contient cette image :

