Image:Milankovitch Variations.png
Un article de Wikipédia, l'encyclopédie libre.
Pas de plus haute résolution disponible.
Milankovitch_Variations.png (479 × 363 pixels, taille du fichier : 32 Kio, type MIME : image/png)
| | Ce fichier provient de Wikimedia Commons?. Les informations le concernant sont affichées ci-dessous (procédure). |
[edit] Description
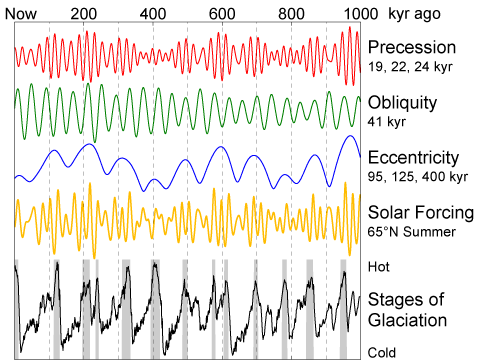
This figure shows the variations in Earth's orbit, the resulting changes in solar energy flux at high latitude, and the observed glacial cycles.
According to Milankovitch Theory, the precession of the equinoxes, variations in the tilt of the Earth's axis (obliquity) and changes in the eccentricity of the Earth's orbit are responsible for causing the observed 100 kyr cycle in ice ages by varying the amount of sunlight received by the Earth at different times and locations, particularly high northern latitude summer. These changes in the Earth's orbit are the predictable consequence of interactions between the Earth, its moon, and the other planets.
The orbital data shown are from Quinn et al. (1991). Principal frequencies for each of the three kinds of variations are labeled. The solar forcing curve (aka "insolation") is derived from July 1st sunlight at 65 °N latitude according to Jonathan Levine's insolation calculator [1]. The glacial data is from Lisiecki and Raymo (2005) and gray bars indicate interglacial periods, defined here as deviations in the 5 kyr average of at least 0.8 standard deviations above the mean.
 |
This image should be recreated using vector graphics as an SVG file. This has several advantages; see Commons:Media for cleanup for more information. If an SVG form of this image is already available, please upload it. After uploading an SVG, replace this template with template {{Vector version available|new image name.svg}} in this image. |
|
العربية | Български | Català | Česky | Dansk | Deutsch | English | Esperanto | Español | Français | 한국어 | Italiano | Magyar | Lietuvių | Nederlands | 日本語 | Polski | Português | Română | Русский | Suomi | Svenska | Türkçe | Українська | Tiếng Việt | मराठी | 中文(繁體) | 中文(简体) | +/- |
|
[edit] Copyright
This image was produced by Robert A. Rohde from publicly available data, and is incorporated into the Global Warming Art project.
This image is an original work created for Global Warming Art.
Permission is granted to copy, distribute and/or modify this image under either:
- The GNU Free Documentation License Version 1.2; with no Invariant Sections, Front-Cover Texts, or Back-Cover Texts.
- The Creative Commons Attribution-NonCommercial-ShareAlike License Version 2.5
Please refer to the image description page on Global Warming Art for more information
 |
Permission is granted to copy, distribute and/or modify this document under the terms of the GNU Free Documentation License, Version 1.2 only as published by the Free Software Foundation; with no Invariant Sections, no Front-Cover Texts, and no Back-Cover Texts. A copy of the license is included in the section entitled "Text of the GNU Free Documentation License."
العربية | Català | Česky | Deutsch | English | Español | فارسی | Français | Italiano | 日本語 | Nederlands | Norsk (bokmål) | Polski | Português | Русский | Svenska | Türkçe | Tiếng Việt | 中文(简体) | 中文(繁體) | +/- |
[edit] References
- Lisiecki, L. E., and M. E. Raymo (2005), A Pliocene-Pleistocene stack of 57 globally distributed benthic d18O records, Paleoceanography 20, PA1003, doi:10.1029/2004PA001071.[2]
- Quinn, T.R. et al. "A Three Million Year Integration of the Earth's Orbit." The Astronomical Journal 101 pp. 2287-2305 (June 1991).
Historique du fichier
Cliquer sur une date et une heure pour voir le fichier tel qu’il était à ce moment-là
| Date et heure | Dimensions | Utilisateur | Commentaire | |
|---|---|---|---|---|
| actuel | 11 février 2006 à 13:35 | 479×363 (32 Kio) | David Legrand | (== Description == This figure shows the variations in Earth's orbit, the resulting changes in solar energy flux at high latitude, and the observed glacial cycles. According to Milankovitch Theory, the precession of the [[) |
Pages contenant l’image
Les pages ci-dessous contiennent cette image :

