Image:Debris-LEO1280.jpg
Un article de Wikipédia, l'encyclopédie libre.
Taille de cet aperçu : 600 × 600 pixels
Image en plus haute résolution (1 280 × 1 280 pixels, taille du fichier : 258 Kio, type MIME : image/jpeg)
| | Ce fichier provient de Wikimedia Commons?. Les informations le concernant sont affichées ci-dessous (procédure). |
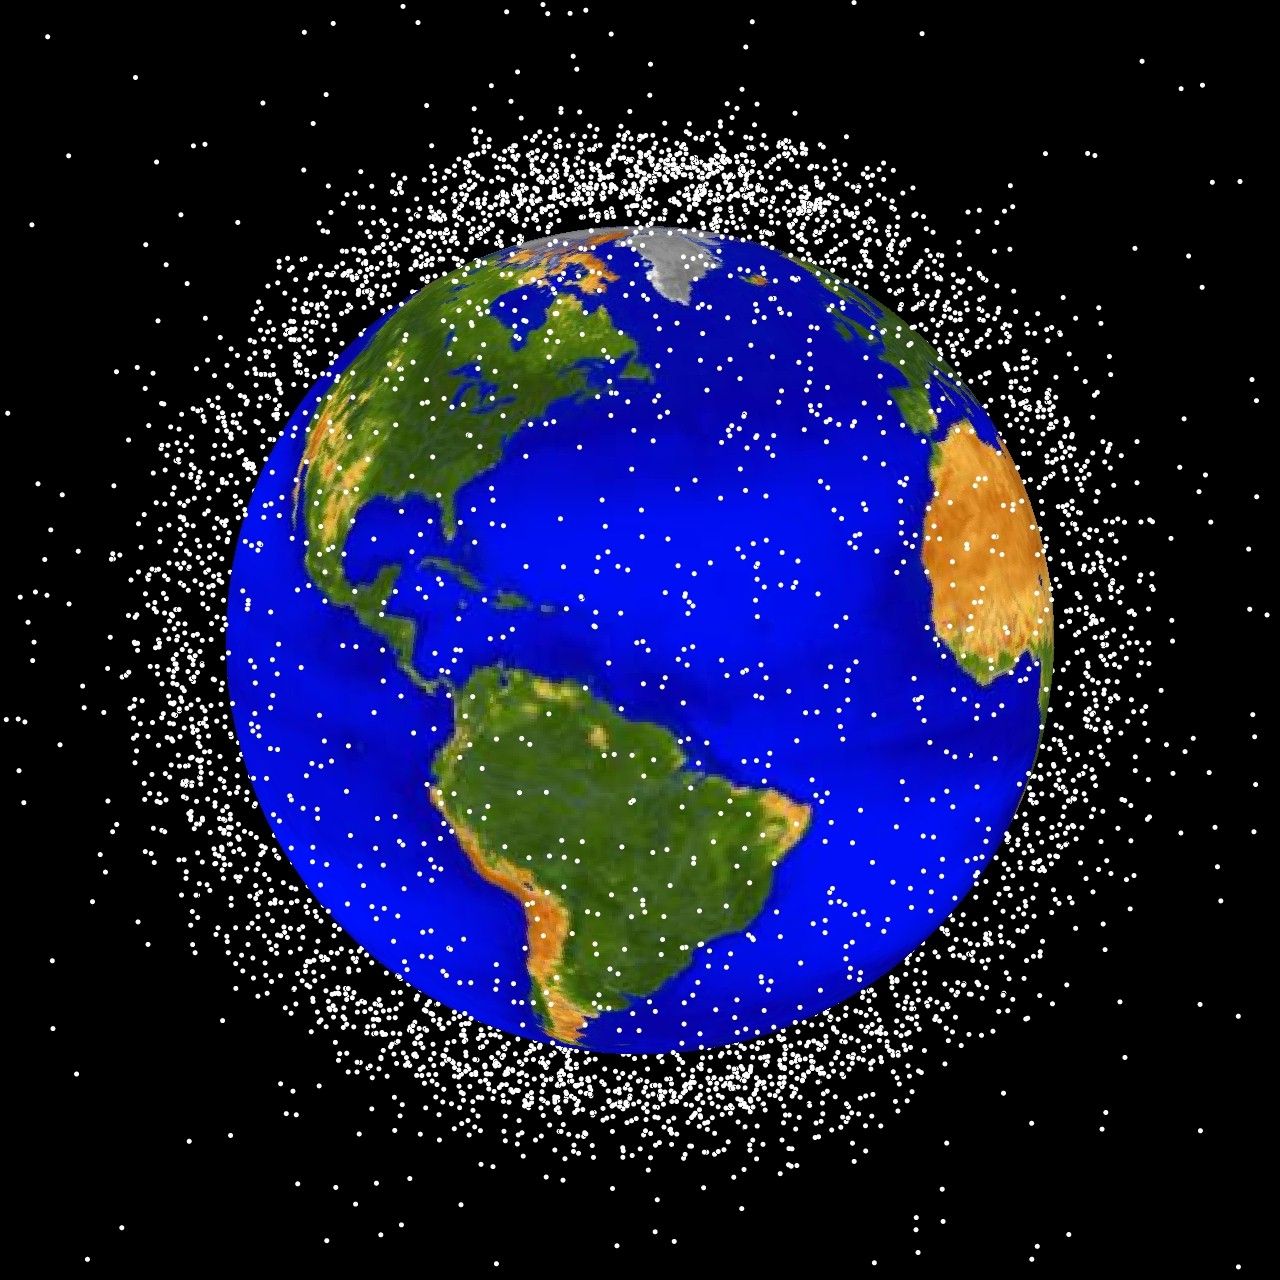
debris plot by NASA
Source: http://sn-callisto.jsc.nasa.gov/photogallery/beehives.html
|
|
This file is in the public domain because it was created by NASA. NASA copyright policy states that "NASA material is not protected by copyright unless noted". (NASA copyright policy page or JPL Image Use Policy).
Deutsch | English | Español | Français | Nederlands | Português | Русский | 中文(简体) | 中文(繁體) | +/- |
|
 |
Warnings:
|
Describtion: The following graphics are computer generated images of objects in Earth orbit that are currently being tracked. Approximately 95% of the objects in this illustration are orbital debris, i.e., not functional satellites. The dots represent the current location of each item. The orbital debris dots are scaled according to the image size of the graphic to optimize their visibility and are not scaled to Earth. These images provide a good visualization of where the greatest orbital debris populations exist. Below are the graphics generated from different observation points.
LEO stands for low Earth orbit and is the region of space within 2,000 km of the Earth's surface. It is the most concentrated area for orbital debris.
Historique du fichier
Cliquer sur une date et une heure pour voir le fichier tel qu’il était à ce moment-là
| Date et heure | Dimensions | Utilisateur | Commentaire | |
|---|---|---|---|---|
| actuel | 1 février 2005 à 18:48 | 1 280×1 280 (258 Kio) | Srbauer | (debris plot by NASA) |
Pages contenant l’image
La page ci-dessous contient cette image :

