Image:2005bauxite.png
Un article de Wikipédia, l'encyclopédie libre.
Taille de cet aperçu : 800 × 351 pixels
Image en plus haute résolution (1 425 × 625 pixels, taille du fichier : 58 Kio, type MIME : image/png)
| | Ce fichier provient de Wikimedia Commons?. Les informations le concernant sont affichées ci-dessous (procédure). |
[edit] Description
| Description |
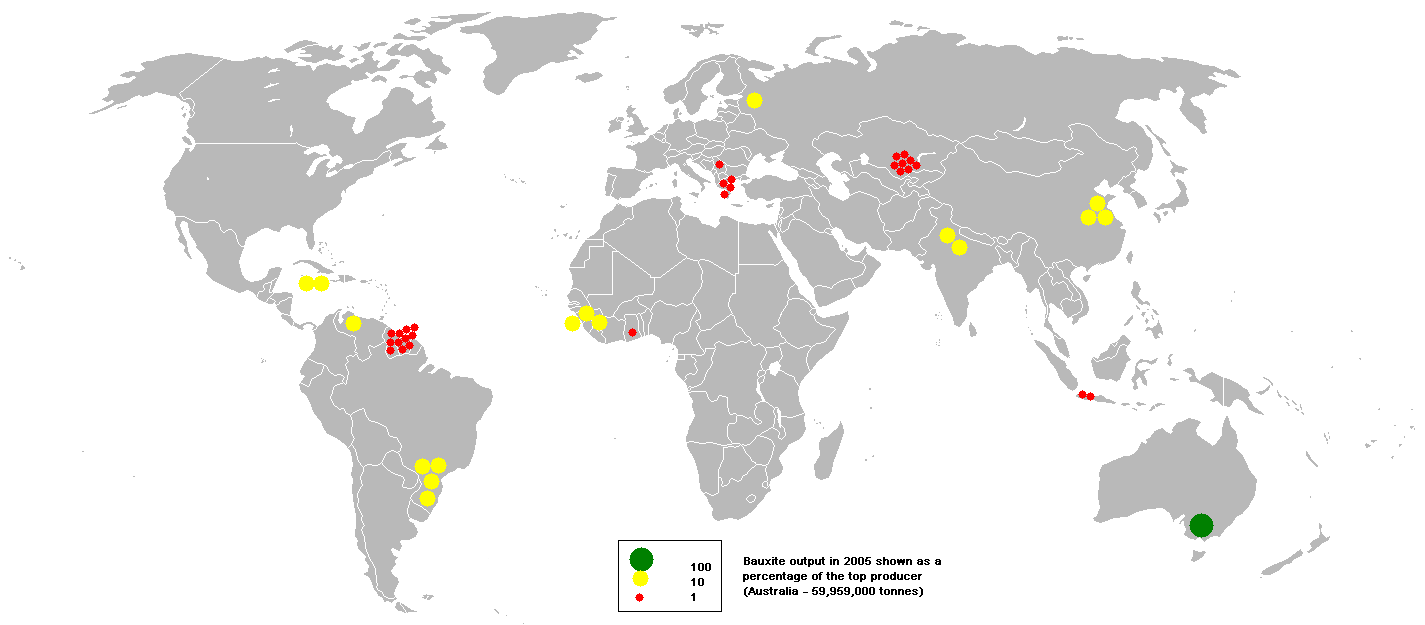
This bubble map shows the global distribution of bauxite output in 2005 as a percentage of the top producer (Australia - 59,959,000 tonnes). This map is consistent with incomplete set of data too as long as the top producer is known. It resolves the accessibility issues faced by colour-coded maps that may not be properly rendered in old computer screens. Data was extracted on 3rd June 2007. Source - British Geological Survey http://www.bgs.ac.uk/mineralsuk/commodity/world/home.html Based on Image:BlankMap-World.png |
|---|---|
| Source |
http://www.bgs.ac.uk/mineralsuk/commodity/world/home.html [1] |
| Date |
March 2008 |
| Author | |
| Permission (Reusing this image) |
see below |
[edit] Licensing
 |
Permission is granted to copy, distribute and/or modify this document under the terms of the GNU Free Documentation License, Version 1.2 or any later version published by the Free Software Foundation; with no Invariant Sections, no Front-Cover Texts, and no Back-Cover Texts. Subject to disclaimers. Asturianu | Български | Català | Deutsch | English | Español | Français | Gaeilge | Italiano | 한국어 | 日本語 | Polski | Português | Română | Türkçe | +/- |
Historique du fichier
Cliquer sur une date et une heure pour voir le fichier tel qu’il était à ce moment-là
| Date et heure | Dimensions | Utilisateur | Commentaire | |
|---|---|---|---|---|
| actuel | 4 mars 2008 à 22:45 | 1 425×625 (58 Kio) | Toony | ({{Information |Description=This bubble map shows the global distribution of bauxite output in 2005 as a percentage of the top producer (Australia - 59,959,000 tonnes). This map is consistent with incomplete set of data too as long as the top producer is k) |
Pages contenant l’image
La page ci-dessous contient cette image :


![[1]](http://en.wikipedia.org/wiki/Image:2005bauxite.PNG)