Image:Outflow bndry.png
Un article de Wikipédia, l'encyclopédie libre.
Taille de cet aperçu : 318 × 598 pixels
Image en plus haute résolution (1 236 × 2 325 pixels, taille du fichier : 1,3 Mio, type MIME : image/png)
| | Ce fichier provient de Wikimedia Commons?. Les informations le concernant sont affichées ci-dessous (procédure). |
| Description |
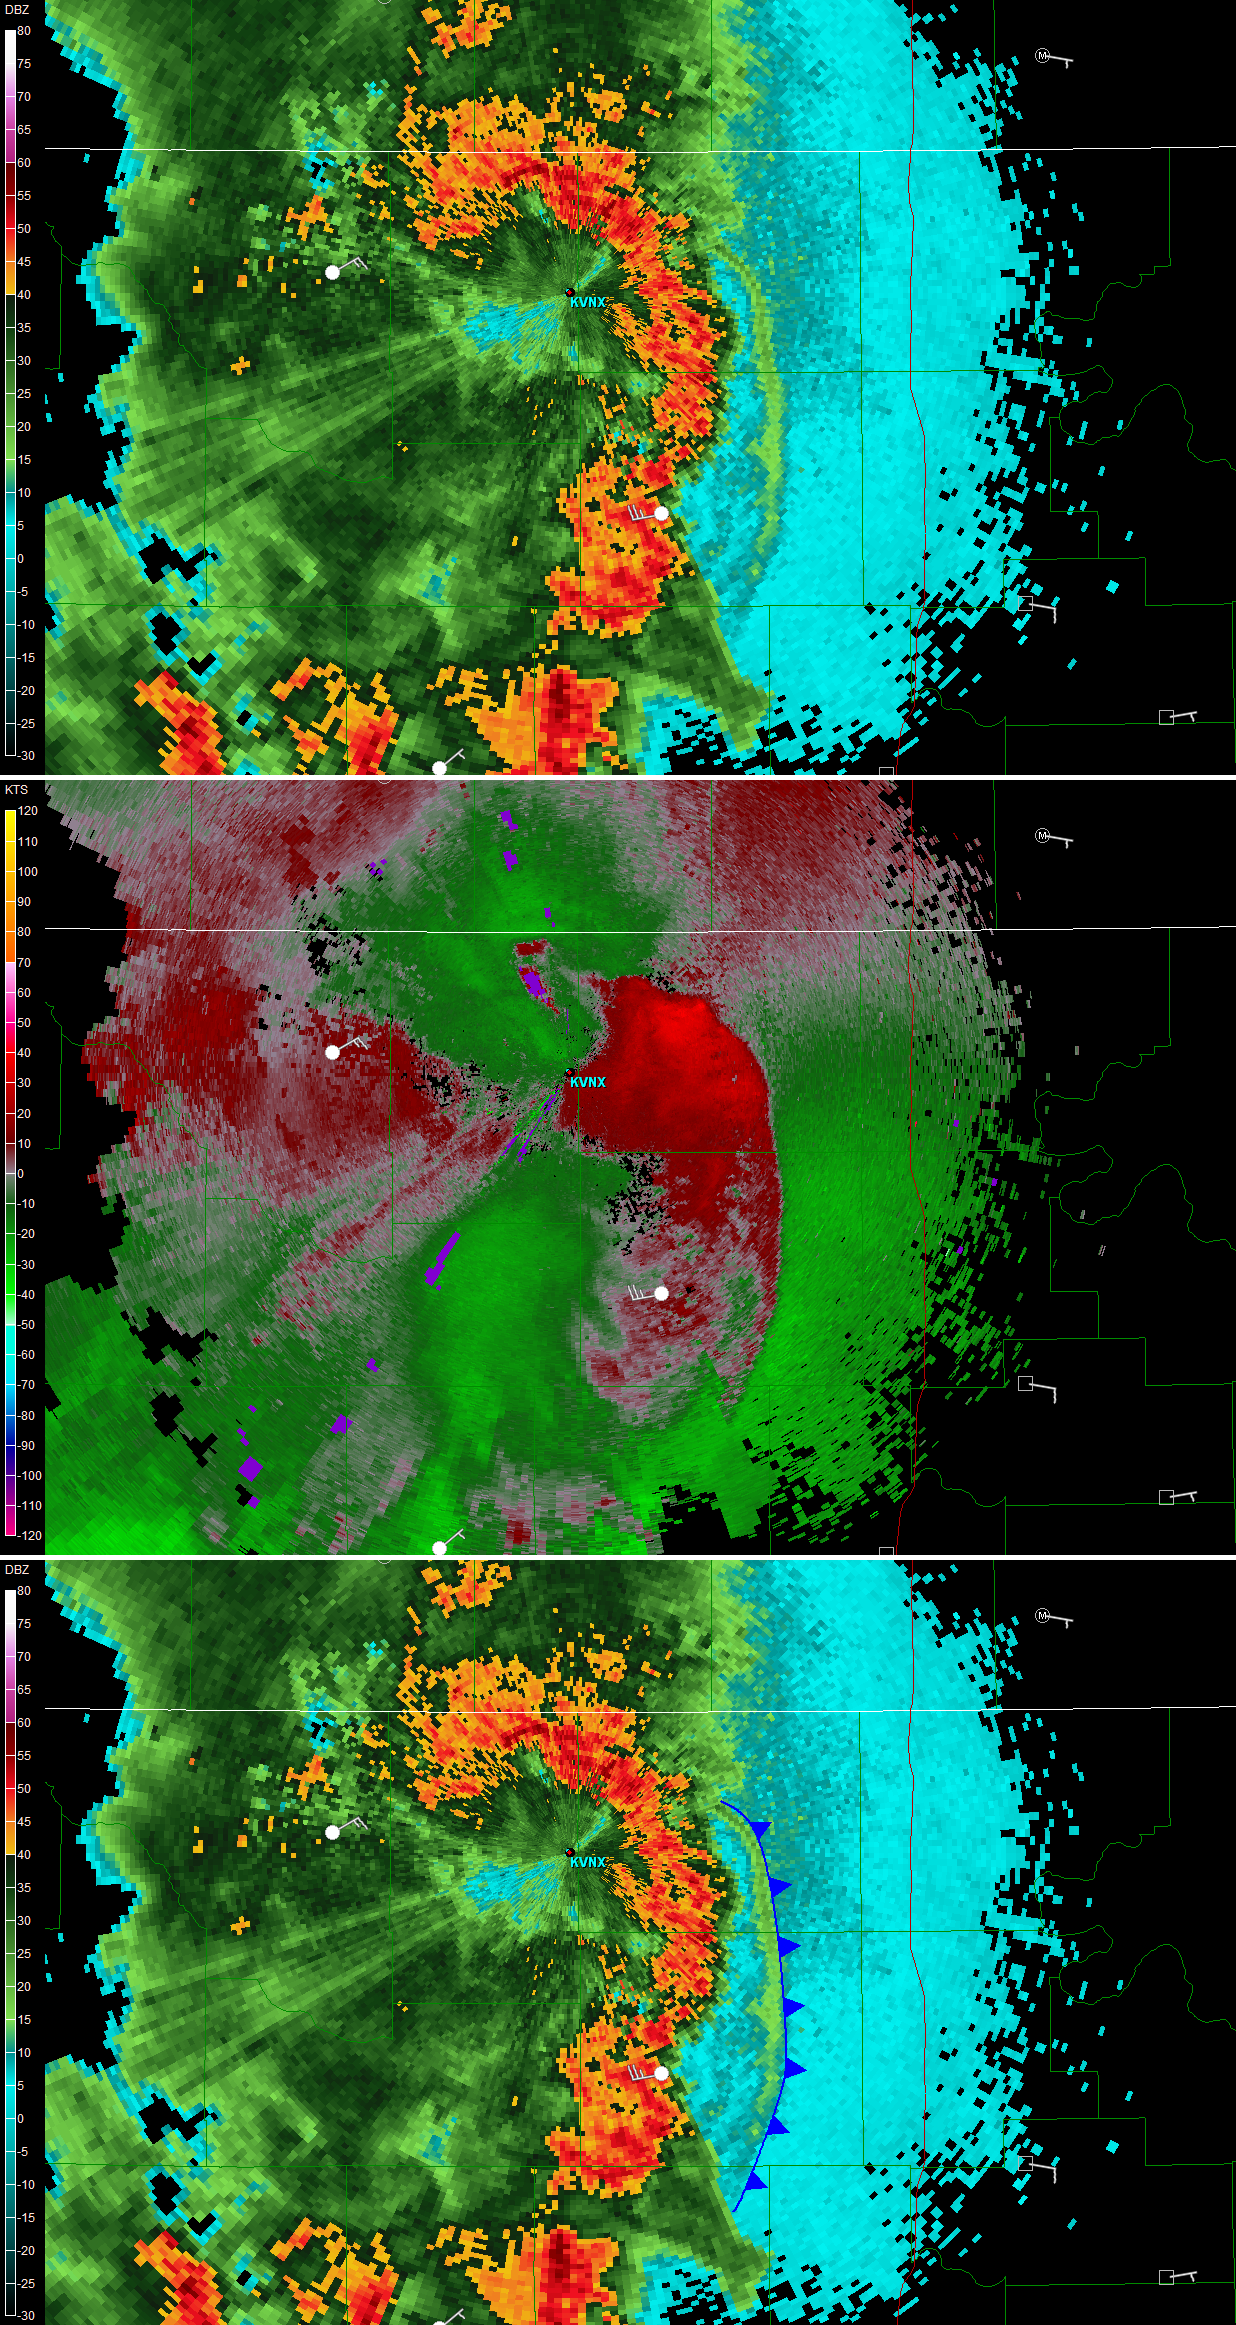
Coposite radar image of an outflow boundary coming from a Thumderstorm. Upper image shows strong reflectivities in the thunderstorms (Red) while a weaker line of echoes (Light green in the cyan area to the right) indicate the convection generated by the gust front. In the centre, the Doppler velocities relative the radar shows a zone of convergence (red away from radar and green towards it) on the outer edge of the weak line of echoes. At the bottom, the outflow boundary is indicated on the reflectivity image as a cold front line. |
|---|---|
| Source |
Created by Vaughan Weather using free NWS level 2 NEXRAD data |
| Date |
00:45, 18 October 2007 (UTC) |
| Author | |
| Permission (Reusing this image) |
see below |
| Other versions | en:Image:Outflow bndry.png |

Historique du fichier
Cliquer sur une date et une heure pour voir le fichier tel qu’il était à ce moment-là
| Date et heure | Dimensions | Utilisateur | Commentaire | |
|---|---|---|---|---|
| actuel | 18 octobre 2007 à 02:45 | 1 236×2 325 (1,3 Mio) | Pierre cb | ({{Information |Description=Coposite radar image of an outflow boundary coming from a Thumderstorm. Upper image shows strong reflectivities in the thunderstorms (Red) while a weaker line of echoes (Light green in the cyan area to the right) indicate the co) |
Pages contenant l’image
La page ci-dessous contient cette image :

